A finance team moves from spreadsheets to AI-powered intelligence through four stages, in order: manual Excel, one clean source of truth, automated reporting and reconciliation, then prediction and intelligence such as cash-flow forecasting and fraud detection. Each stage removes a specific pain and unlocks the next. The stage everyone wants is the last one, but you cannot reach it by skipping the two in the middle, because a forecasting model is only as good as the clean, reconciled data underneath it.
That is the part most “AI for finance” pitches leave out. The model is not the hard part. The hard part is turning scattered, error-prone spreadsheets into financial data that an intelligence layer can actually trust. This is a data journey first and an AI journey second, and the order matters.
Most finance leaders already feel the limits of stage one. PwC benchmarking finds finance teams spend roughly 30% of their time collecting data and reconciling it between systems (PwC Finance Effectiveness Benchmark), time spent rekeying and cross-checking instead of analysing. The four stages below are how you win that time back, one step at a time.
The four stages at a glance
Before the detail, here is the whole path: where you start, what each stage adds, and the pain it removes. Notice that intelligence sits on top of clean data and automation, never beside them.
Stage 1: Manual Excel, and where it breaks
Almost every finance team starts here, and for good reason. Spreadsheets are flexible, familiar, and cost nothing to open. They handle expense reports, cash-flow projections, and budget summaries well enough when the company is small.
The trouble starts as the business scales, and it shows up in three predictable ways:
- Version chaos. “Final_v3_USE_THIS.xlsx” is a real file on someone’s desktop. When the source of truth is a file that gets emailed around, you lose track of which copy is current, and two people quietly edit different versions of the same number.
- Manual errors that nobody catches. A 2024 peer-reviewed literature review found that 94% of business spreadsheets used in decision-making contain errors (Poon et al, Frontiers of Computer Science, 2024). A mistyped formula or a dragged-down cell can shift a forecast by lakhs, and a spreadsheet has no audit trail to flag it.
- No real-time view. Spreadsheets look backward. By the time the numbers are gathered, cleaned, and pasted together, the picture is already days old, so leadership is steering by last week’s data.
None of this means Excel is bad. It means Excel is the wrong place to keep the data your whole finance operation depends on. The fix is not a fancier spreadsheet. It is moving the data out of files and into one place.
Stage 2: Centralize the data into one source of truth
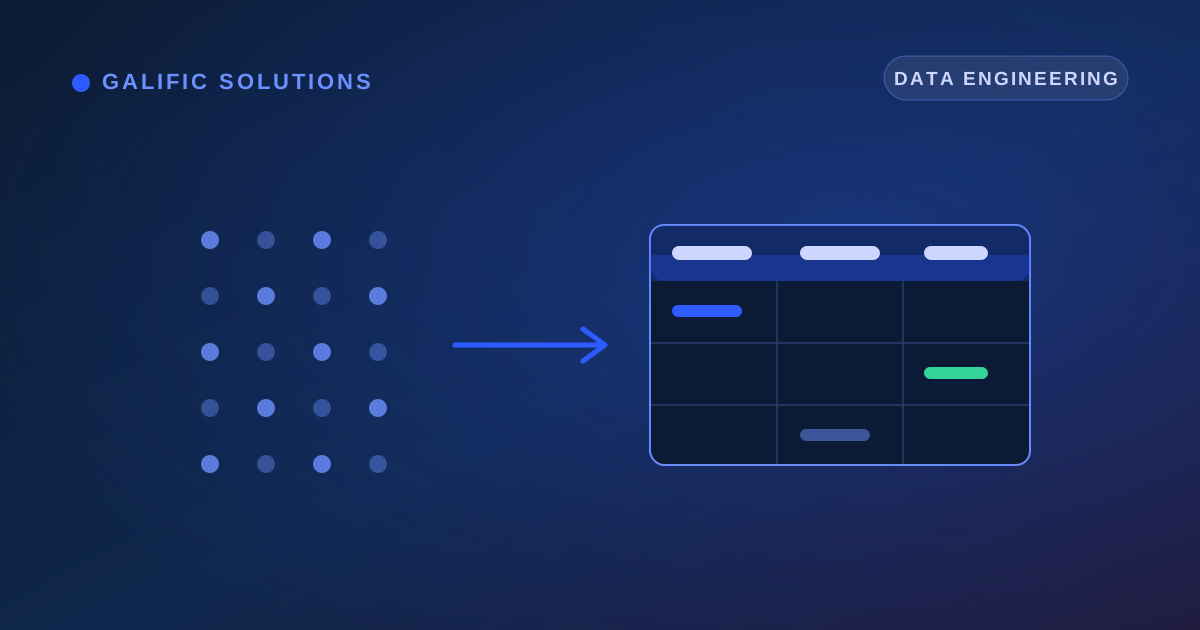
This is the stage that everyone is tempted to skip and the one that makes everything after it possible. Instead of financial data living in dozens of files and the odd accounting tool, you pull it into one central, governed store, then clean and validate it so the numbers are consistent.
In practice that means a few concrete things:
- Connect the sources. Pull transactions from your accounting software, bank statements, your enterprise resource planning (ERP) system, sales tools, and the spreadsheets you cannot yet retire, into one place.
- Clean and standardize. Fix the small inconsistencies that quietly break everything later: the same vendor spelled three ways, dates in mixed formats, duplicate entries, currency mismatches. This is the unglamorous work that decides whether stage four ever succeeds.
- Digitize what is still on paper. Many Indian SMEs still hold invoices, vouchers, and ledgers as hard copy. Those have to become structured records before they can be analysed at all.
The pain it removes: version chaos and silent errors. There is now one number everyone trusts, with a record of where it came from. What it unlocks: because the data is clean and in one place, you can finally automate on top of it. You cannot automate a mess; you can automate a single, validated source. This is the data-engineering and data-digitization layer of the journey, and it is the foundation the rest of the journey stands on.
Stage 3: Automate reporting and reconciliation
With clean data in one place, the repetitive work can run itself. This is the stage where finance teams feel the biggest immediate relief, because it directly attacks the manual hours.
Two things get automated first:
- Reporting. Instead of someone rebuilding the same cash-flow statement or management report every month by copying cells, reports refresh automatically from the source of truth. Leadership sees current numbers without anyone assembling them by hand.
- Reconciliation. Matching invoices to payments, bank lines to the ledger, and statements to records is the classic month-end grind. Automated matching handles the clean cases and surfaces only the genuine exceptions for a human to resolve.
The prize here is time and speed. PwC benchmarking puts finance teams at roughly 30% of their time on collecting and reconciling data (PwC Finance Effectiveness Benchmark), and that is exactly the work this stage removes. The close speeds up too, which matters because it has barely improved on its own: APQC benchmarking shows the median month-end close has hovered around six days for nearly a decade, and fewer than one in five teams close in three days or fewer (APQC, industry benchmarks). Automation is what finally moves that number.
The pain it removes: manual hours and a slow, late close. What it unlocks: a steady stream of clean, structured, reconciled data flowing in on a schedule. That continuous, trustworthy feed is precisely what a predictive model needs to learn from, which is why this stage has to come before the next one.
Stage 4: Add prediction and intelligence
Only now, on top of clean, automated, reconciled data, does AI earn its place. At this stage the system stops just reporting what happened and starts telling you what is likely to happen and what to do about it. Three applications matter most for finance:
- Cash-flow forecasting. A model trained on your payment history, invoice ageing, and seasonal patterns predicts your cash position weeks ahead, so you see a squeeze coming instead of discovering it. This is time-series forecasting applied to your own ledger, not a generic template.
- Anomaly and fraud detection. A model learns your normal transaction patterns and flags what does not fit: a duplicate payment, an invoice that is abnormally large, a vendor appearing at an odd time. Traditional rule-based checks miss subtle cases and bury teams in false alarms; a model tuned on your own history catches more and complains less. We apply exactly this in ML-powered reconciliation.
- Collections prioritization. Instead of chasing every overdue invoice equally, a model scores which accounts are most likely to slip, so your team works the riskiest receivables first and protects cash.
Notice what makes all three possible: each one is a model trained on your data. A forecast learns from a clean payment history. Anomaly detection learns from a consistent record of normal transactions. None of it works on the versioned, error-ridden spreadsheets of stage one, which is the whole reason the earlier stages are not optional. Skip them and the model simply learns the mess. This is the data intelligence layer, and it is built last for a reason.
Why you cannot skip stages 2 and 3
It is worth saying plainly, because it is the single most expensive mistake in finance AI. The appealing pitch is “deploy AI cash-flow forecasting.” The reality is that prediction is the top of a stack, and the stack has to be built from the bottom.
- Skip stage 2 and your model trains on inconsistent, duplicated, partly-wrong data. It will produce confident forecasts that are quietly garbage, which is worse than no forecast at all.
- Skip stage 3 and there is no reliable, current data flowing in. A model that ran once on a stale export is not intelligence; it is a one-off report that goes out of date immediately.
Each stage pays for itself before the next begins. Centralizing the data removes version chaos. Automating removes manual hours. Only then does prediction add a genuinely new capability. That sequencing is also why a serious project starts with an honest look at the data, not with the model.
The data-company way to do it: audit first
A finance team is really moving raw data up a value chain: scattered records become one clean source, then automated flows, then intelligence, then a decision such as “hold this payment” or “we will be short on cash in three weeks.” Galific is built around that chain, and around doing it in the right order.
That is why every engagement starts with a low-cost data audit, not code. The audit answers the only question that matters before you spend on a build: can your financial data actually support the forecasting or detection you want, or does stage two need work first? It is honest, it is cheap, and it stops you paying for a model your data cannot feed. From there we centralize and clean the data, automate the reporting and reconciliation, and add prediction last, wired into the tools your team already uses. It is delivered from India and priced for SMEs, and it sits alongside the rest of our finance and fintech work.
If you would rather see it before committing, the simplest starting point is to ask plain-language questions of your own numbers and get answers back, which is what our ask-your-data tool does on top of a clean source of truth. When you are ready to map your own stages, get in touch and we will start with the audit.
The journey from Excel to AI-powered finance is not a leap. It is four steps, taken in order, where each one removes a real pain and earns the right to the next.